Suunto Ambit3 Sport User Guide - 2.5
Running performance level
Running performance level is a combined measurement of your physical fitness and your running efficiency, powered by Firstbeat.
Physical fitness
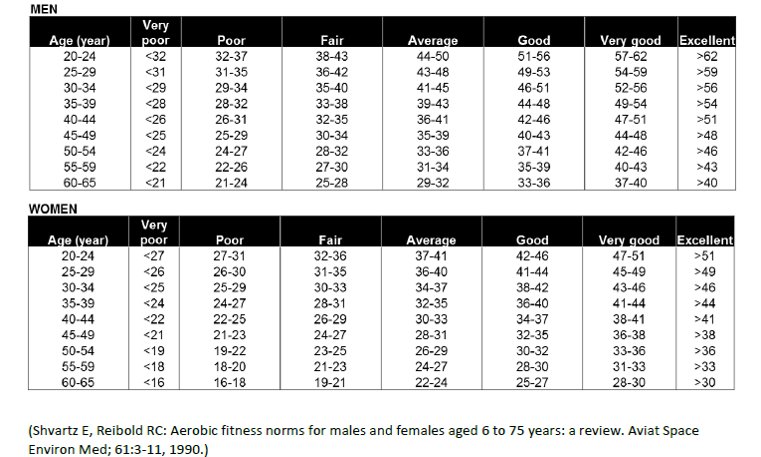
Running performance level uses an estimation of your VO2max, a global standard for aerobic fitness and endurance performance. V02max indicates your body’s maximal capability to transport and utilize oxygen.
V02max is affected by the condition of your heart, lungs, circulatory system, and the ability of your muscles to utilize oxygen in energy production. VO2max is the most important single denominator of endurance performance of an athlete.
In addition, research has indicated that VO2max is also an important measure for health and wellbeing. At optimum running efficiency, your running performance level corresponds to your real VO2max (ml/kg/min).
Running efficiency
Running performance level also takes into account running efficiency, a measurement of your running technique. This measurement also takes into account external factors such as terrain, running surface, weather, and running gear.
During a run
Your Suunto Ambit3 Sport provides real-time running performance feedback during your run.
The real-time feedback is available as a graph display in the default Running sport mode. You can add this graph to any sport mode that uses the running activity type. The real-time difference (see below) can also be used as a data field in your custom running sport modes.
During your run, the graph display shows your four data points, as illustrated below.
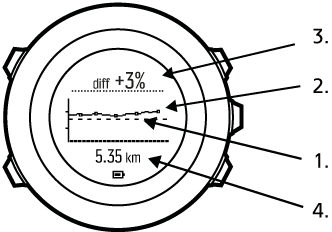
- Baseline: for each run, your running performance baseline is calibrated to compensate for external variables such as terrain and to wait for your heart rate to stabilize.
- Real-time level: this is your real-time running performance level for the current run displayed per kilometer/mile.
- Real-time difference: this shows you the real-time difference between the calibrated running performance baseline and your real-time running performance level for the current run.
- Distance: total distance for the current recording. The graph shows the last six kilometers (~4 miles).
Interpreting the results
If you are new to running or just haven't been out for a while, your running performance may be quite low at first. But as your physical fitness and running technique improve, you should see a corresponding increase in running performance.
Over a 4-20 week period, you may see an increase in running performance level up to 20%. If your running performance level is already good, it is difficult to improve further. In this situation, running performance level is better used as an endurance indicator.
Following the real-time difference indicator provides detailed, granular information on daily performance and fatigue during the run. Endurance runners can use this information to learn how much fatigue seems manageable during long intensive runs. During races, this information helps you pace yourself properly.
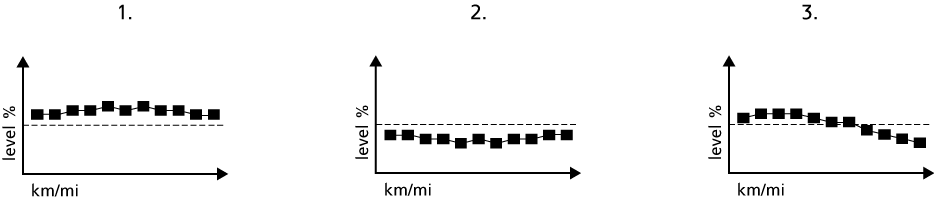
Illustrated below are three samples running performance levels during runs. In the first graph (1), performance is good. In the second (2), performance is bad and may indicate over training, illness, or just generally bad conditions. In the third graph (3), you see a typical long distance run where performance level drops steadily later in the run, indicate onset of fatigue.