The definition of insanity, they say, is doing the same thing over and over again and expecting a different result. This holds true for our training. It’s easy to get stuck in a groove, running on autopilot, and wondering why we’re not getting the results we hoped for. But if you turn off autopilot and start paying attention to the details with a metric-based approach then you’ll see how to tweak things so your performance starts tracking upwards.
This is what the partnership between Suunto and TrainingPeaks is all about; to give you the tools and data to take command of your training. You track your workouts with your Suunto watch and TrainingPeaks gives you in-depth analysis and planning tools to achieve your full potential. After each activity, you can analyze your heart rate, power, pace and other data to determine where you are at. (Read more about the benefits you get with Suunto & TrainingPeaks.)
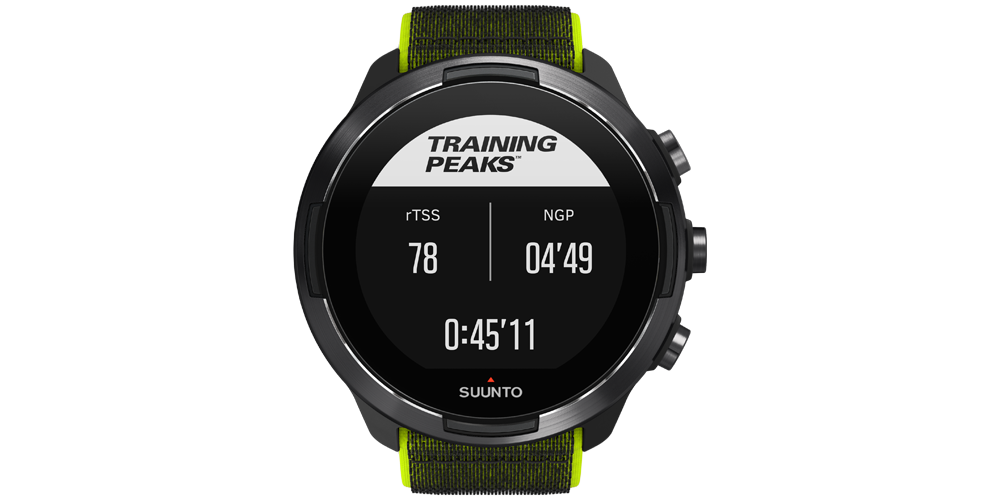
On Suunto 9 and Suunto 5 watches you are able to follow selected TrainingPeaks metrics in real-time. This lets you adjust the effort and duration of the exercise on the go, helping you reach your goal. hrTSS, rTSS, NGP and other TrainingPeaks metrics can be accessed in the SuuntoPlus section of Suunto 9 and Suunto 5 watches.
Two phases of metrics-based training
You can learn from metrics in two phases, in real-time with your Suunto 9 or Suunto 5 while you’re training, or post workout back at home by analyzing the results on TrainingPeaks. Both are valuable and both can help you to refine and improve your training.
Running Training Stress Score (rTSS)
The most useful tools to quantify how hard you’re training are those metrics that account for both the volume and the intensity of your running. TSS in cycling uses power as the criterion measure of intensity, and this overcomes many of the limitations associated with the use of heart rate when quantifying intensity. Since running speed is a function of power, and for most runners, speed or pace is the measure of greatest interest, we can use the same principles applied in the TSS system to quantify training stress in running. In particular, the elements of the normalized graded pace (NGP; see below), relative to the functional threshold pace in conjunction with the duration of the workout we can determine an appropriate rTSS score for each workout.
The stressfulness of any given pace is determined in relation to your current functional threshold pace (that is, the fastest running pace you could sustain for one hour). The calculation makes adjustments for hills (for example, a hilly 40-minute run at a steady pace of 8:00/mile would generate a higher TSS than a flat version of the same run) and even for the fact that running at any given pace becomes more physiologically stressful the longer that pace is sustained. This can give us an apples to apples comparison for training stress incurred by a track workout versus a long steady run versus a fartlek run, or any other workout. It provides the framework by which we can see the big picture, or the forest despite the trees.
Learn more about Running Training Stress Score (rTSS) at TariningPeaks.com
Normalized Graded Pace (NGP)
Normalized Graded Pace (NGP) is the adjusted pace reported from a global positioning system (GPS), or other speed/distance device, that reflects the changes in grade and intensity that contribute to the physiological cost of running on varied terrain. We can derive NGP from flatland running, such as on a running track, but NGP really shines when applied to pace data obtained on undulating or even hilly terrain.
Some readers, who come from cycling backgrounds and have used power meters, may recognize the similarity in name of NGP with Normalized Power (NP) from cycling. The inspiration for NGP came from the work of Andrew Coggan, Ph.D. and his development of NP. For coaches and/or athletes who participate in multi-sports, and have used NP and Training Stress Scores (TSS) for cycling, there has been a great desire to extend the principles and utility of the NP/TSS system to other disciplines. The obvious first extension that comes to mind is running. The recent availability of downloadable GPS recording devices makes the adaptation of the NP/TSS system to running an attractive proposition. An in depth discussion of the concepts of NP and TSS can be found here.
The long and the short of it, however, is power is the cycling analog of pace in running. In fact, if we plotted power vs. pace at a constant speed, for a given runner, there would be a very close relationship; they change proportionally. So, if you are a runner, and you track training based on pace, you are indirectly tracking power. So, the underlying principles of NP in cycling hold for what can be termed Normalized Graded Pace (NGP) in running.
Learn more about Normalized Graded Pace (NGP) at TrainingPeaks.com
Intensity Factor® (IF®)
Intensity Factor gives you relative intensity in running by comparing Normalized Graded Pace to an-aerobic threshold pace. Therefore Intensity Factor is a valid and convenient way of compare the relative intensity of a training session or race either within or between runs, taking into account changes or differences in threshold pace.
In Suunto watches we use the treshold as limit between Zone 4 and Zone 5. This means that the effort you have been running is a share from an-aerobic threshold level. Intensity factor gives you a simple info on how hard you are working out. Suunto watches use a intensity zones where Pace Zone 4 | Zone 5 limit equals the lactate threshold / an-aerobic threshold level. The rTSS in Suunto watch uses this level to calculate the proper rTSS value. You can find the pace zone setup on your watch settings: Training » Intensity zones » Advanced zones.
The Intensity Factor for recovery workouts should be under 0.75, for endurance runs 0.75-0.85, for tempo workouts 0.85-0.95 and for an-aerobic threshold intervals 0.95-1.05.
Learn more about Intensity Factor at TrainingPeaks.com
READ MORE
View TSS and other power-based cycling metrics in real-time
Training with TSS and hrTSS
Lead image: Kevin Scott Batchelor