The idea of quantifying training stress was first introduced by E.W. Banister and his research colleagues in 1975. Their model is called “Training Impulse'' (TRIMP). TRIMP is calculated using heart rate and duration: a short but intense workout got a higher score than a longer, easier workout.
Since then several different training load models with the same basic principle have been developed: Quantify the training load by taking into consideration the workout duration and intensity.
The most well-known training load metric is Training Peaks’ Training Stress Score, TSS™. Also Suunto app uses TSS to quantify training load. TSS is calculated based on duration and power-based intensity. (When calculating intensity, anaerobic threshold power, normalised power and intensity factor are taken into account. Learn more about the details here.)
To get a better understanding of the TSS values, it is good to know that a one-hour time trial effort equals 100 TSS. At the same time a three-hour easy bike ride can accumulate the same amount of training stress. As said before, the value always depends on the intensity and duration of the effort.
TSS can be based on power, pace or heart rate
While TSS is originally calculated based on anaerobic threshold power, it can also be based on threshold heart rate or threshold running pace. The suitable TSS calculation method depends on the activity type and data available. Suunto app chooses the method and calculates the TSS automatically. Usually heart rate data is used, but in activities like running and swimming TSS is calculated based on threshold pace and in cycling threshold power.
If there are no measurements available, then Suunto app calculates TSS based on a statistical MET (metabolic equivalent) value. The MET based calculation only considers the duration and the activity type and gives a very rough approximation of the TSS. In order to get good quality TSS metrics, use Suunto heart rate, power or pace.
TSS values in Suunto app
TSS (r) –- Running pace
TSS (hr) – Heart rate
TSS (p) – Power
TSS (s) – Swimming pace
TSS (met) – MET base
TSS- – user has edited the value manually
Correct anaerobic threshold is key
Since TSS is based on workout intensity, your intensity zones need to be correctly set up in your Suunto watch. Suunto has five different zones where the upper limit of zone 4 should be your anaerobic threshold. The default zones in your watch are based on heart rate, but you can also set up advanced zones for running (based on heart rate or pace) and cycling (based on heart rate or power). Adjust your intensity zones on your Suunto 3, Suunto 5 or Suunto 9 at ‘Settings’ -> ‘Training’ -> ‘Intensity zones’.
There are basically three ways to define your heart rate zones: an estimate based on your max heart rate, a field test and a lab test. Learn more about intensity zones and about defining them in this article.
TSS quantifies also the long-term training load
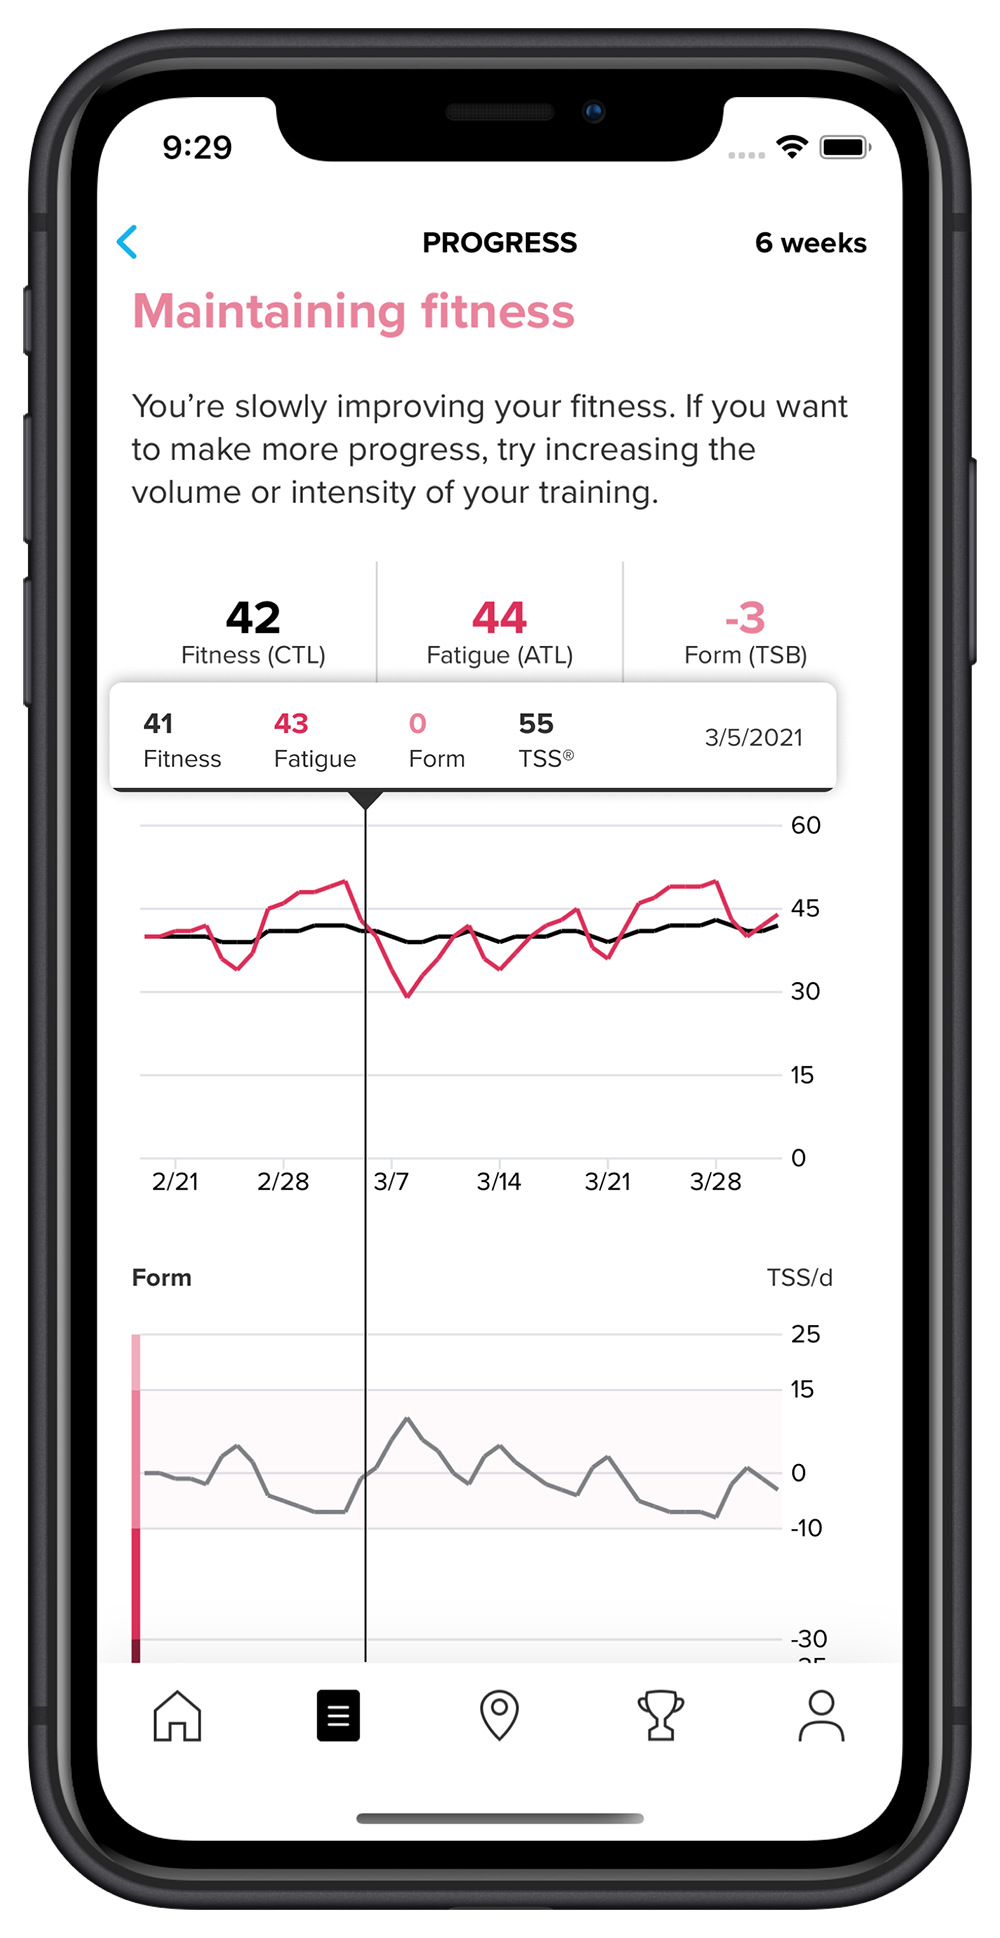
When each of your workouts has a Training Stress Score calculated, long term values can be derived from this. Suunto app Diary’s ‘Progress’ view tracks your training load over time and helps you keep your training in balance – whether that means progress, maintaining your fitness or avoiding over-training.
You will be able to see the long-term load as Cumulative Training Load (CTL) and short-term load as Acute Training Load (ATL). When your CTL and ATL are compared, you will get Training Stress Balance (TSB) that helps you follow changes in your freshness or “form”. Learn more about long-term training load analyses here.
Read more
Training with TSS and hrTSS
Understand and manage your training load with Suunto app
3 TrainingPeaks training metrics to adjust your running on the go
View TSS and other power-based cycling metrics in real-time
Figure out your training zones
Reference
E.W. Banister, T.W. Calvert, M.V. Savage, T. Bach. A systems model of training for athletic performance. Australian Journal of Sports Medicine, (1975) 7:57-61.
Lead image: © Matti Bernitz/Suunto