The key aspect of progressing in your fitness is your ability to increase your training load over a longer period of time. The variables you can play with are training frequency, duration and intensity. With long-term analysis tools powered by TrainingPeaks you can now manage your training better than ever.
To get started with the graphs it is important to understand the basics: Every workout gets a Training Stress Score (TSS) that is based on the intensity and duration of the workout. That’s the base for calculating training load for both short and long-time averages.
Training Stress Score (TSS) is based on your anaerobic threshold power, but it can also be calculated based on your threshold heart rate or your threshold running pace. You can learn more about TSS values here.
These single activities with their automatically calculated TSS values are then used to show your long-term training load. This long-term load is called Chronic Training Load (CTL) or simply “Fitness”. It is a 42-day weighted average of your TSS. The more you train – the more TSS you accumulate in your training – the higher your fitness is.
While your long-term load is shown as “Fitness”, the short-term training load is called “Fatigue” or Acute Training Load (ATL). Fatigue is a 7-day weighted average of your TSS. When increasing training load your fatigue increases faster than fitness.
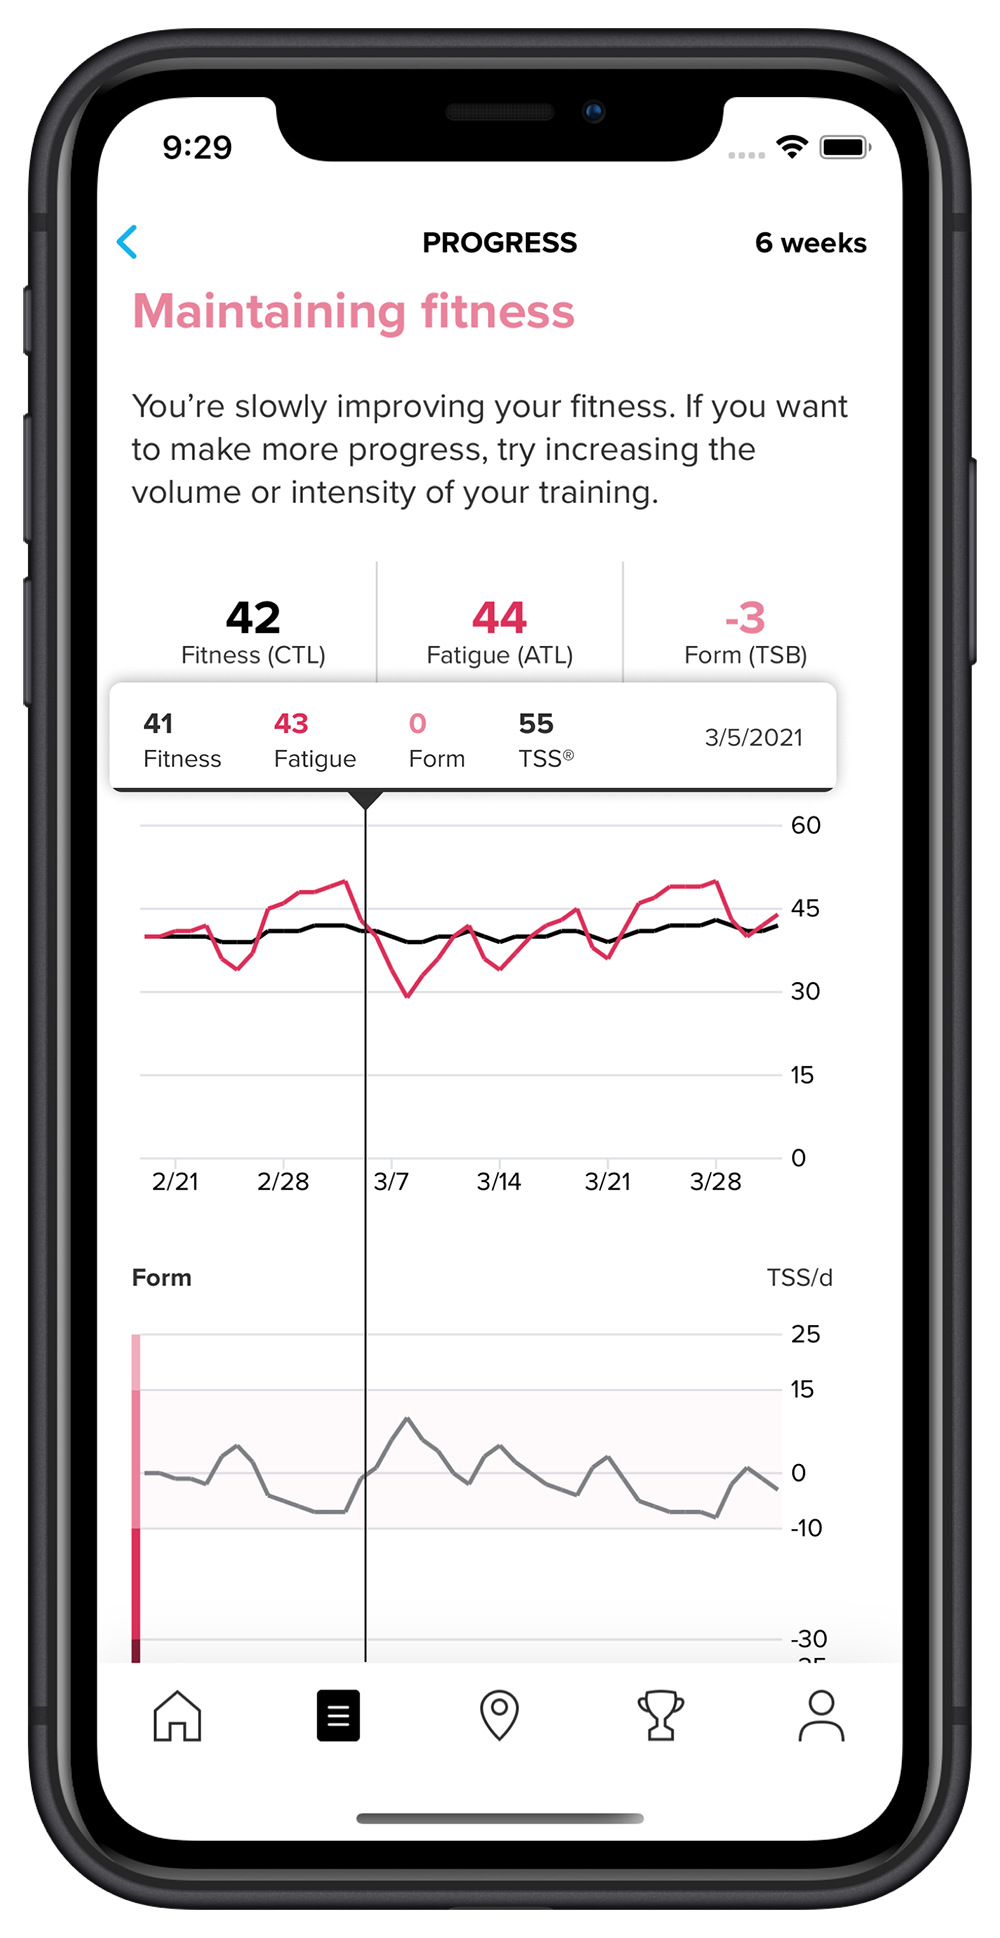
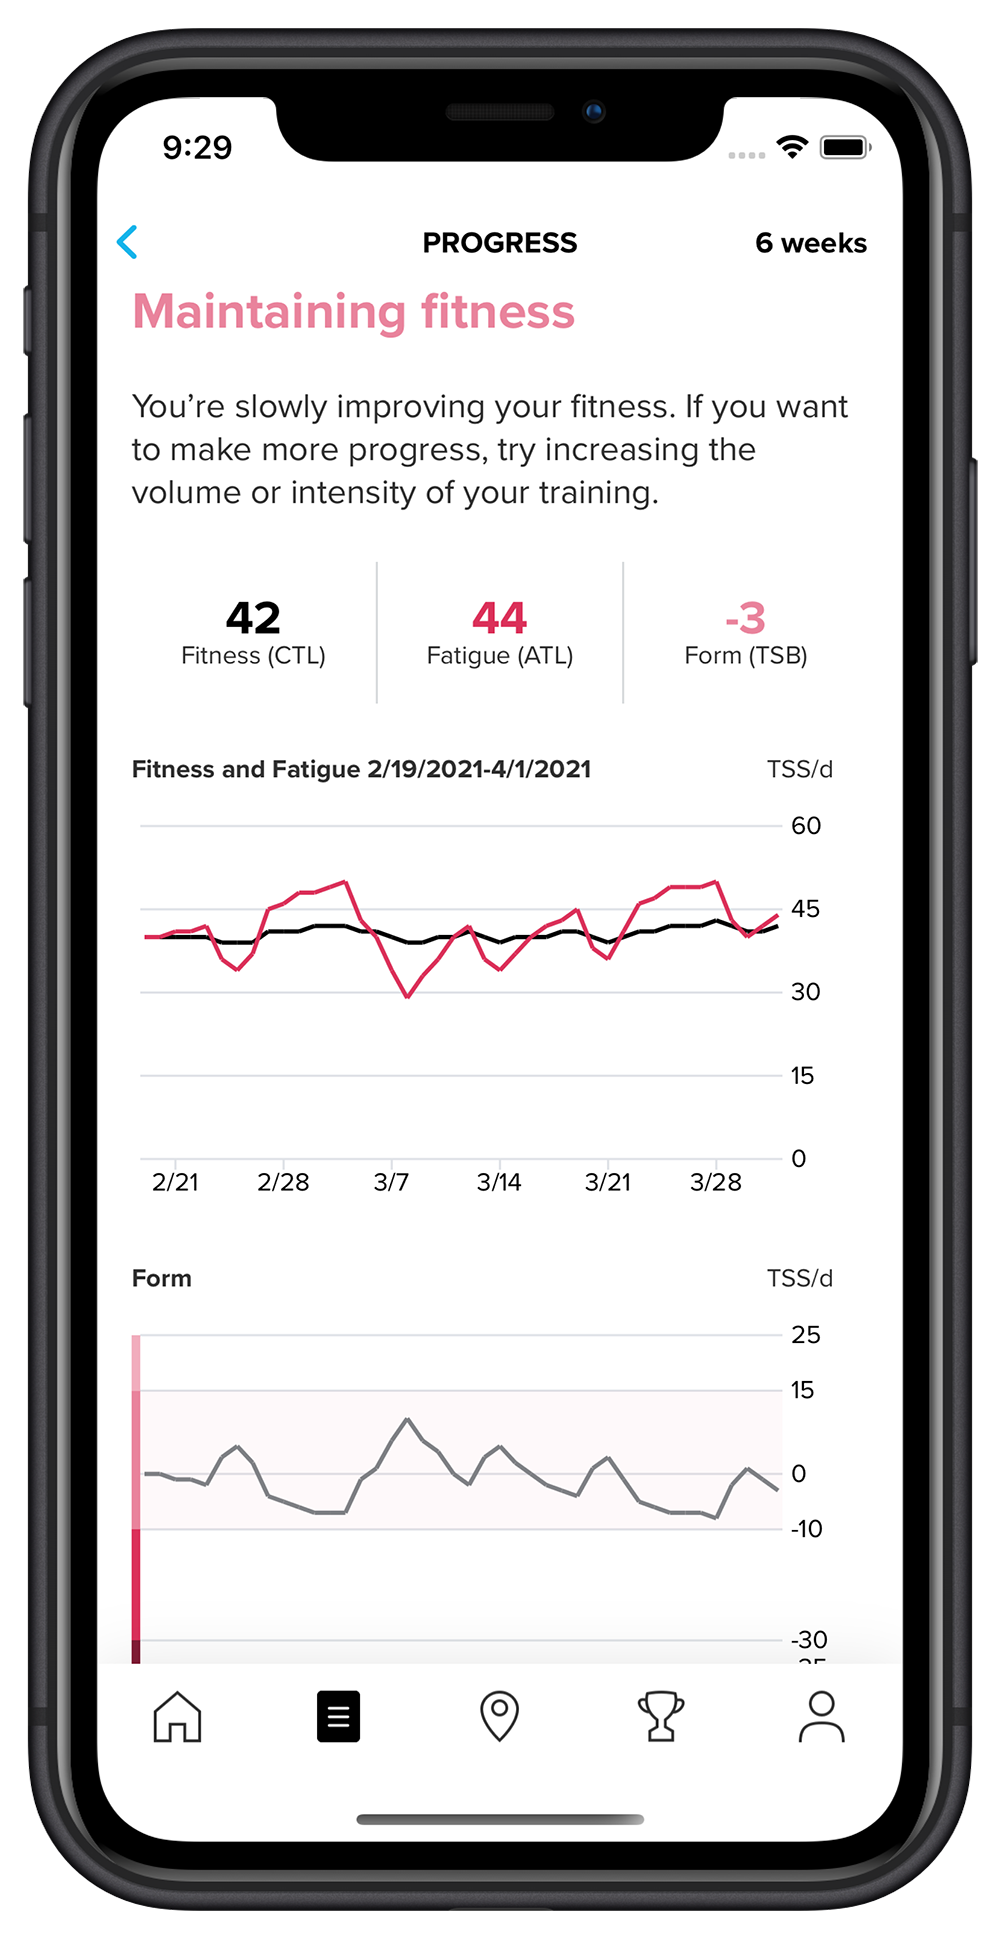
These two values, fitness and fatigue, are shown in the upper graph in your Suunto app’s Diary’s ‘Progress’ view. The lower graph shows your “Form”, or Training Stress Balance. Form is basically the difference between long-term, chronic training load (CTL) and short-term, acute training load (ATL). This graph helps you understand if you are training in a way that is progressive or not. Too much load and you are too tired, too little and you are not moving forward.
In Suunto app the Form graph is divided into four areas: losing fitness, maintaining fitness, productive training and going too hard.
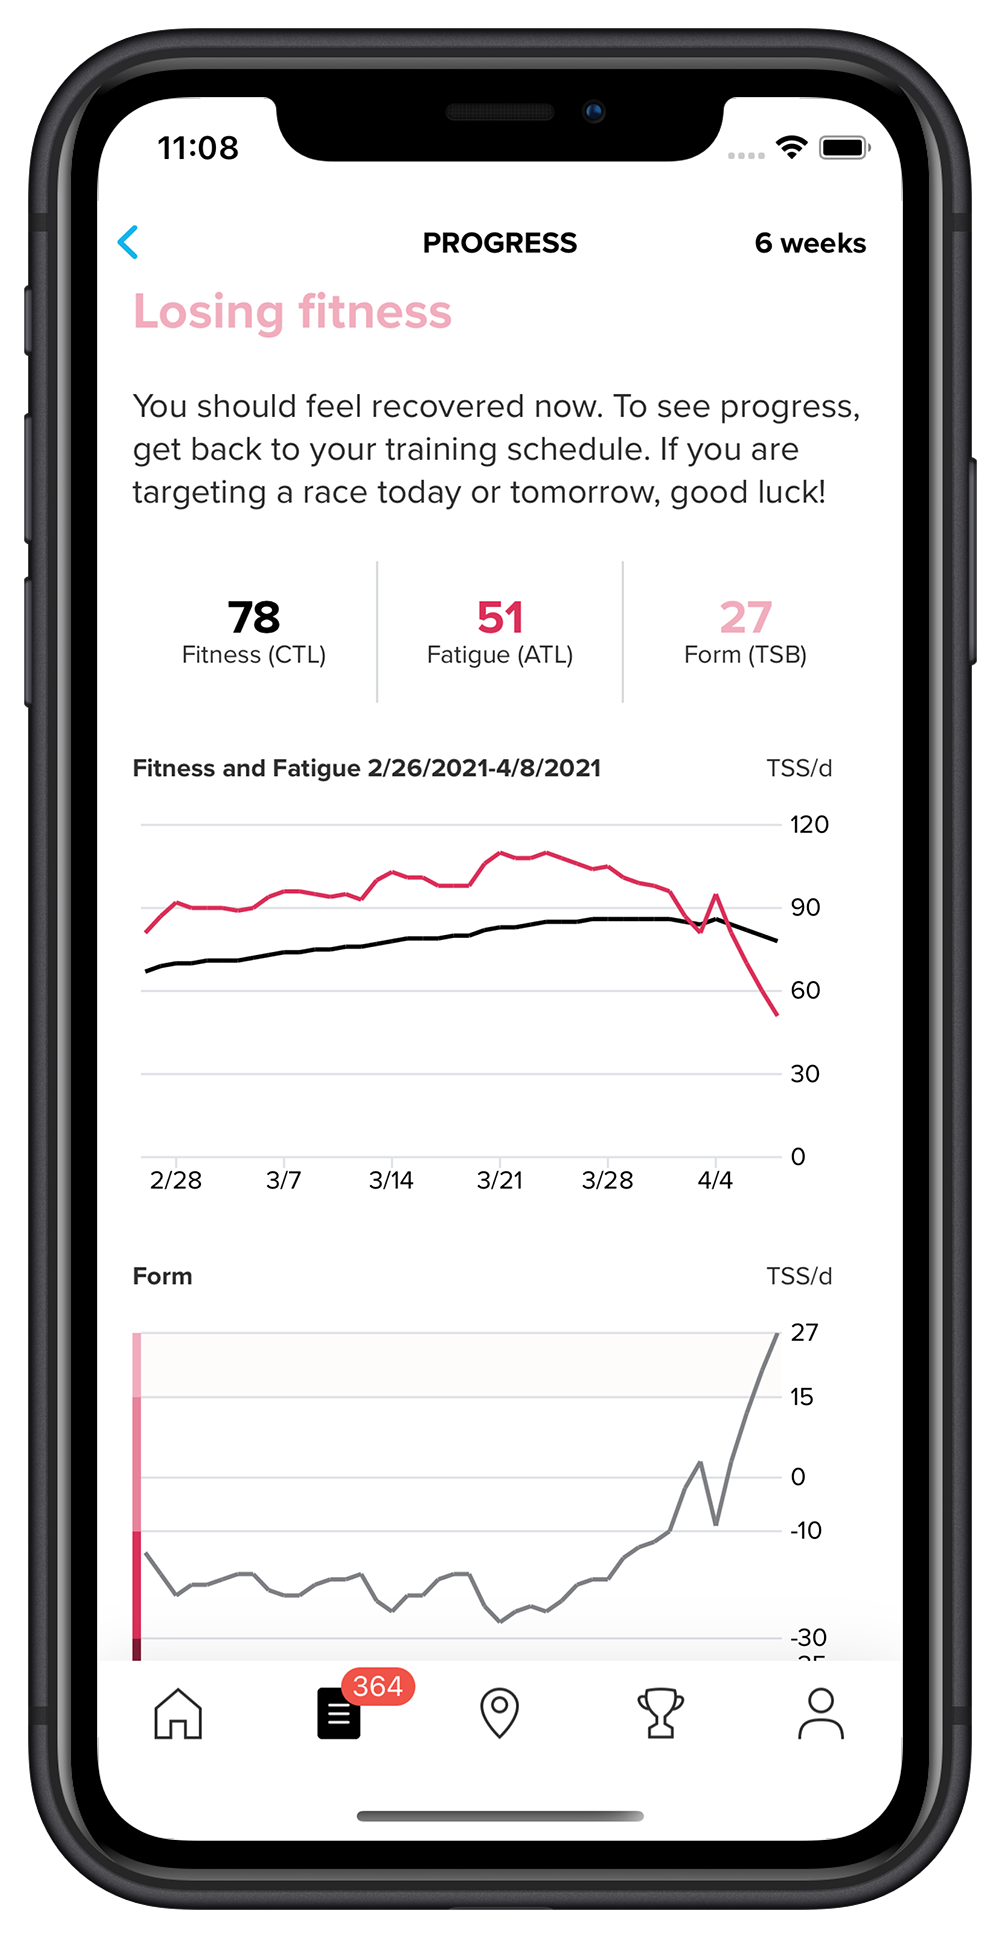
When your long-term, chronic training load is quite a bit higher than your acute, short-term load, you will start to lose fitness. Short-term hitting this area is good, for example when you want to be fresh for a race. However, training easier than you are used to for a longer time, will lead you to losing your fitness.
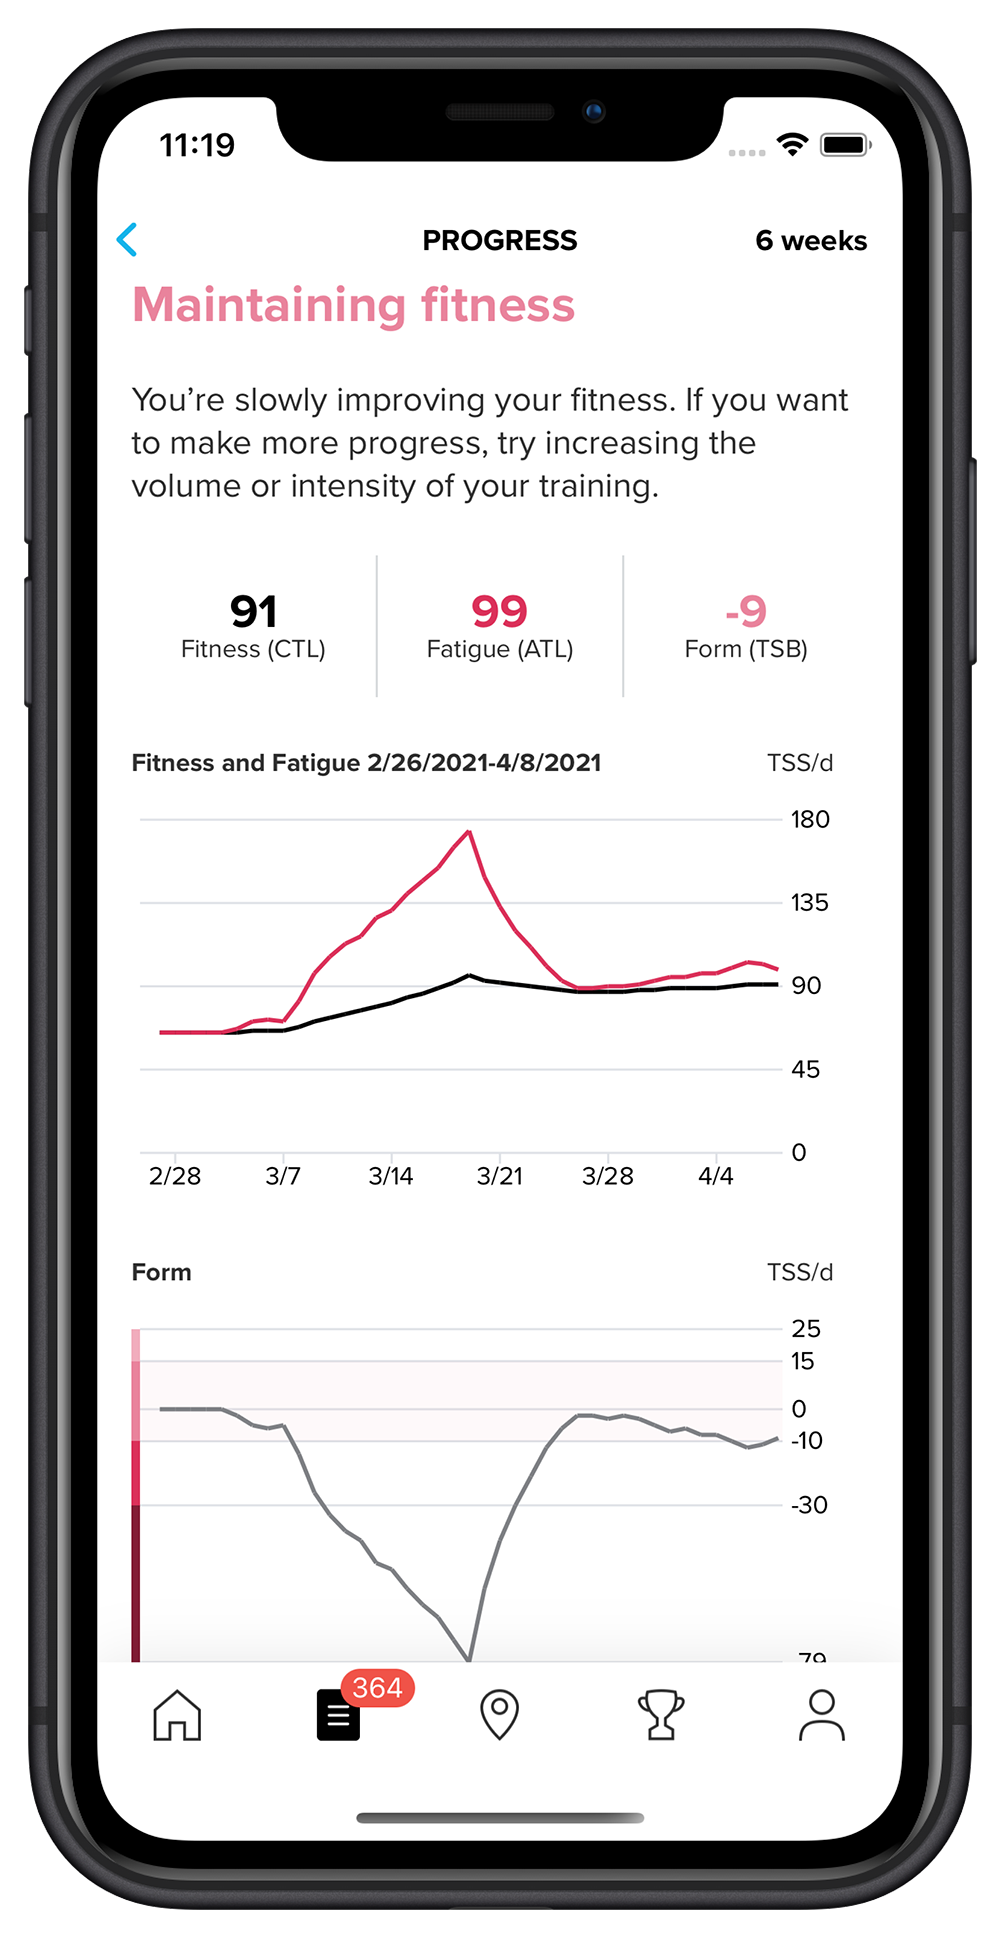
When your current training is roughly in balance with what you are used to doing, you’ll be maintaining your fitness. To improve, add variety and load in your training.
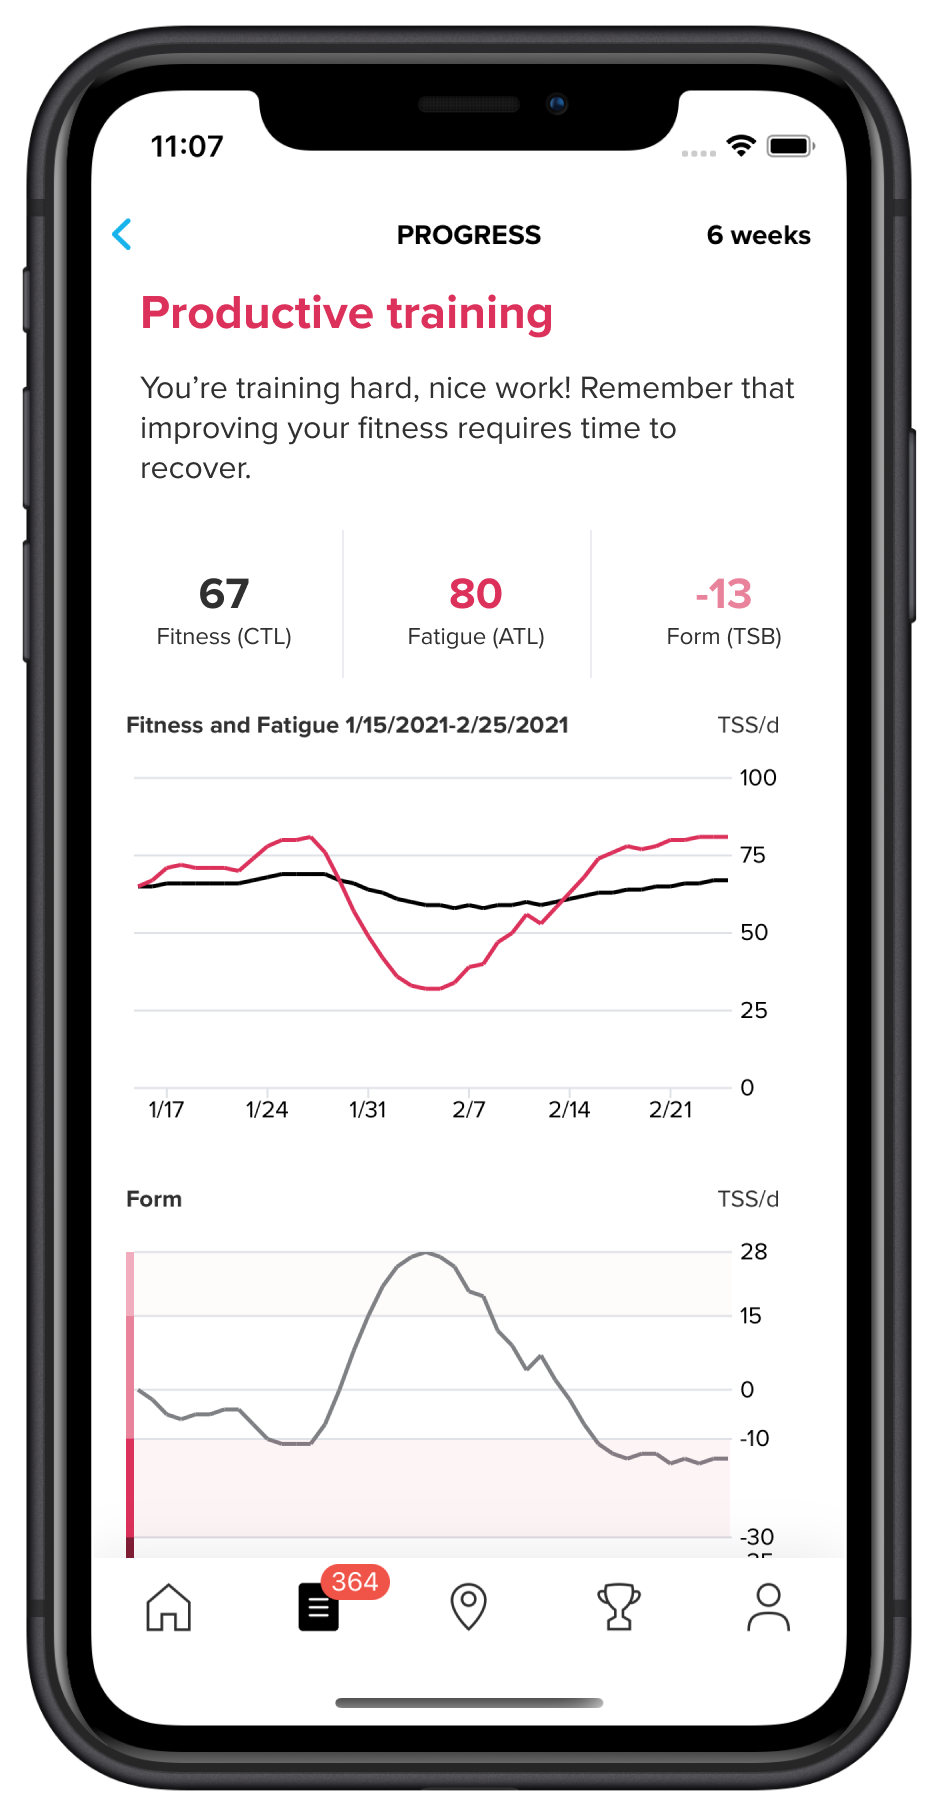
Adding more load will take you to the productive training phase: your fitness and fatigue are increasing in a manageable way. This means you are adding load but not too much compared to what you are used to doing.
If you push too hard and add a lot of training stress compared to your long-term load, your form will drop. This will increase risk of illness and injury and hinder your improvements. Take a step back and allow your body to recover.
Adjust the time frame
When viewing the long-term analyses graphs, you can change the time perspective. Really long-term trends can be seen in the yearly view, that shows the latest four years of your training. In the monthly view you will see the latest 13 months and can easily compare your loads to a year ago, for example. The weekly view with the latest 26 weeks and the daily view with the latest 41 days are more appropriate for managing your current training loads.
If you want to plan your training and see how the graphs will evolve, you can do that with TrainingPeaks’ Performance Management Chart. The activities you track with your Suunto can be automatically synced to TrainingPeaks so you can also use their advanced tools for managing and planning your training. As part of Suunto Value Pack you can get 30 days of TrainingPeaks Premium for free.
Four examples of training load
To make it easier for you to understand what to look for in the graphs, here are four different scenarios:
Example 1: Overload
This graph shows the impacts of a two-week training camp: The training load increases quickly, and at the same time the training stress balance drops very low. In this case the CTL before the camp was 66 and was pushed to 93. At the same time the training stress balance dropped to -79. These low numbers increase the risk of illness and injury.
In this case, the training camp was followed by a recovery week that brought the training stress balance close to zero. Chronic training load still remained at an elevated level (close to 90), so the training camp had a positive impact on this athlete’s fitness.
Example 2: Race
In this graph race preparation is going nicely: The long-term training load is increasing over a long period of time meaning “fitness” is getting better. As the event gets closer, training gets lighter, fatigue goes down and the training stress balance, “form” goes up. The athlete is fresh for the big day.
Example 3: Illness
This graph illustrates the effects of an illness (or other break in training). At first training is going smoothly as CTL is ramping up, but then training stops for one week. ATL goes down quickly and also CTL gets lower. After the break the athlete starts training again gently. It takes about three weeks before her CTL/Fitness starts to be close to the same level she had before the break in training.
Example 4: Normal
This graph illustrates what quite a typical training load graph for an active person may look like: The long-term load is on a fairly good level, but not ramping up. To improve fitness, one needs to add load.
Read more
Training with TSS and hrTSS
Training stress score in Suunto app
3 TrainingPeaks training metrics to adjust your running on the go
View TSS and other power-based cycling metrics in real-time
Figure out your training zones
Main image: © Roger Salanova / Suunto