Suunto 3 Fitness User Guide
Stress and recovery
Your resources are a good indication of your body's energy levels and translate into your ability to handle stress and cope with the day's challenges.
Stress and physical activity deplete your resources, while rest and recovery restore them. Good sleep is an essential part of ensuring your body has the resources it needs.
When your resource levels are high, you will likely feel fresh and energetic. Going for a run when your resources are high means you'll probably have a great run, because your body has the energy it needs to adapt and improve as a result.
Being able to track your resources can help you manage and use them wisely. You can also use your resource levels as a guide to identify stress factors, personally effective recovery boosting strategies, and the impact of good nutrition.
Stress and recovery uses optical heart sensor readings and to get those during the day, daily HR must be enabled, see Daily HR.
It is important that your Max HR and Rest HR are set to match your heart rate to ensure that you get the most accurate readings. By default, the Rest HR is set to 60 bpm and the Max HR is based on your age.
These HR values can easily be changed in the settings under GENERAL -> PERSONAL.
Use the lowest heart rate reading measured during your sleep as your Rest HR.
Press the lower right button to scroll to the stress and recovery display.
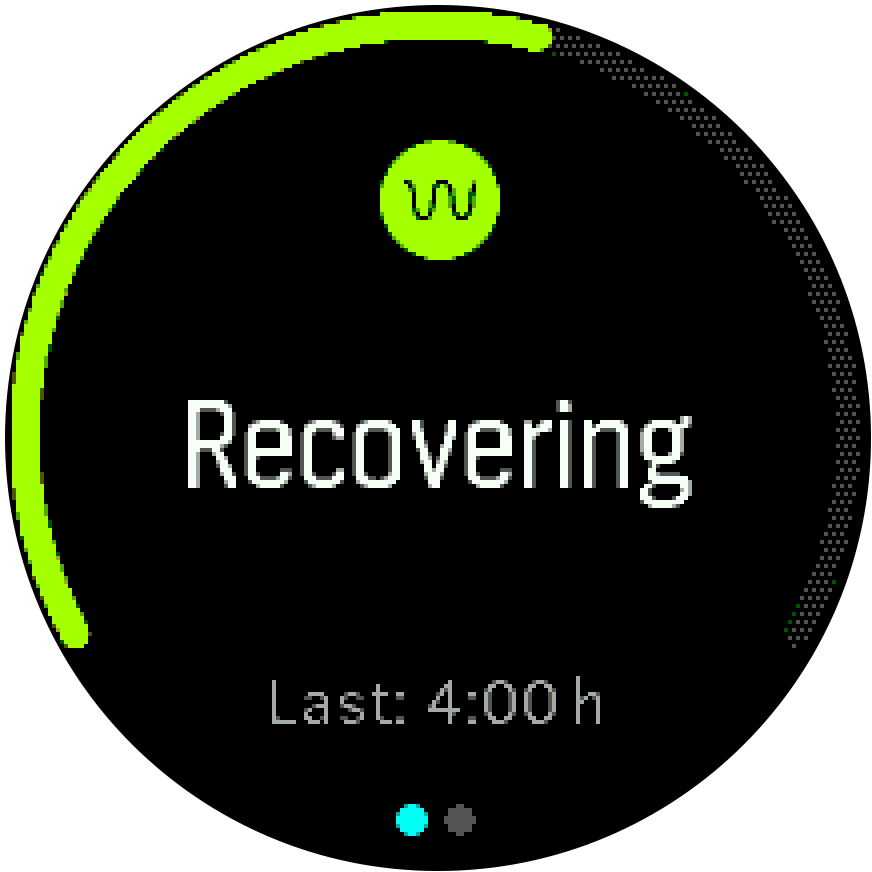
The gauge around this display indicates your overall resource level. If it is green, it means you are recovering. The status and time indicator tell you your current state (active, inactive, recovering or stressed) and for how long you have been in that state. In this screenshot, for example, you have been recovering for the last four hours.
Press the middle button to see a bar chart of your resources over the last 16 hours.
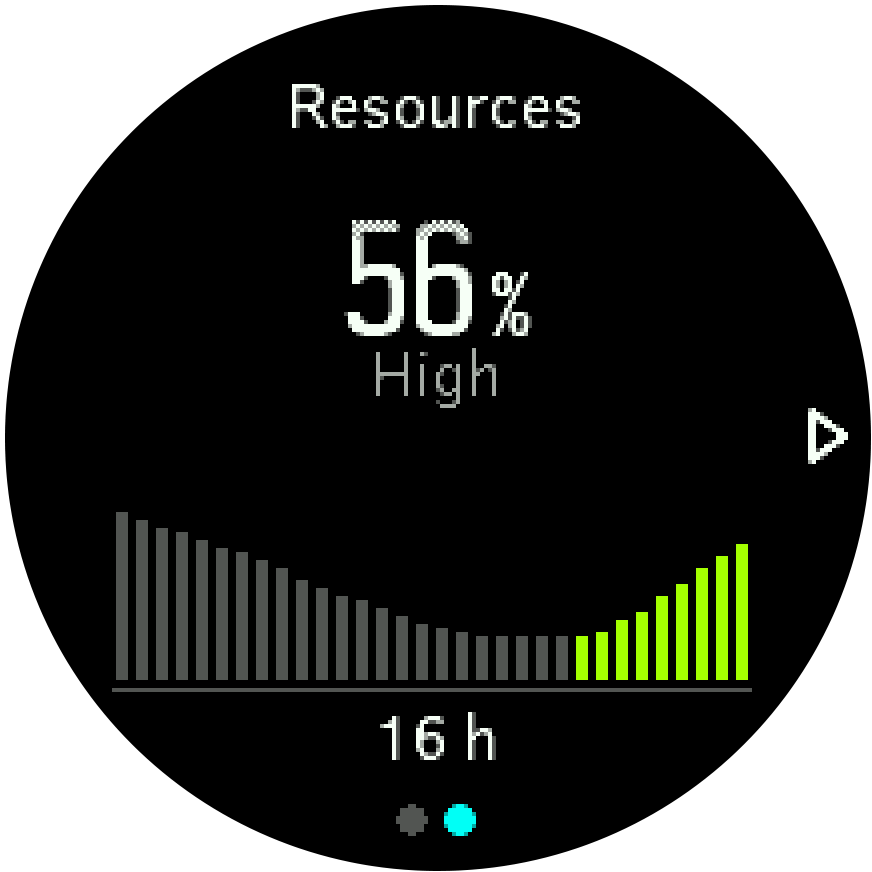
The green bars indicate periods where you have been recovering. The percentage value is an estimate of your current resource level.